Training Report
Track and improve your indoor rowing results with EXR’s personalized Performance Reports. You can view them in the application by accessing your Past Sessions in the Rower Hub.
In all modes (except Buoy Blast), you get a detailed summary when stopping your workout. It consists of 3 parts:
- The Social Report displays your route, shows an overview of your challenges and achievements, and features a “Rowed With” tab to follow rowers who passed nearby (regardless of their route). The Social Report is not available when opening a Past Session.
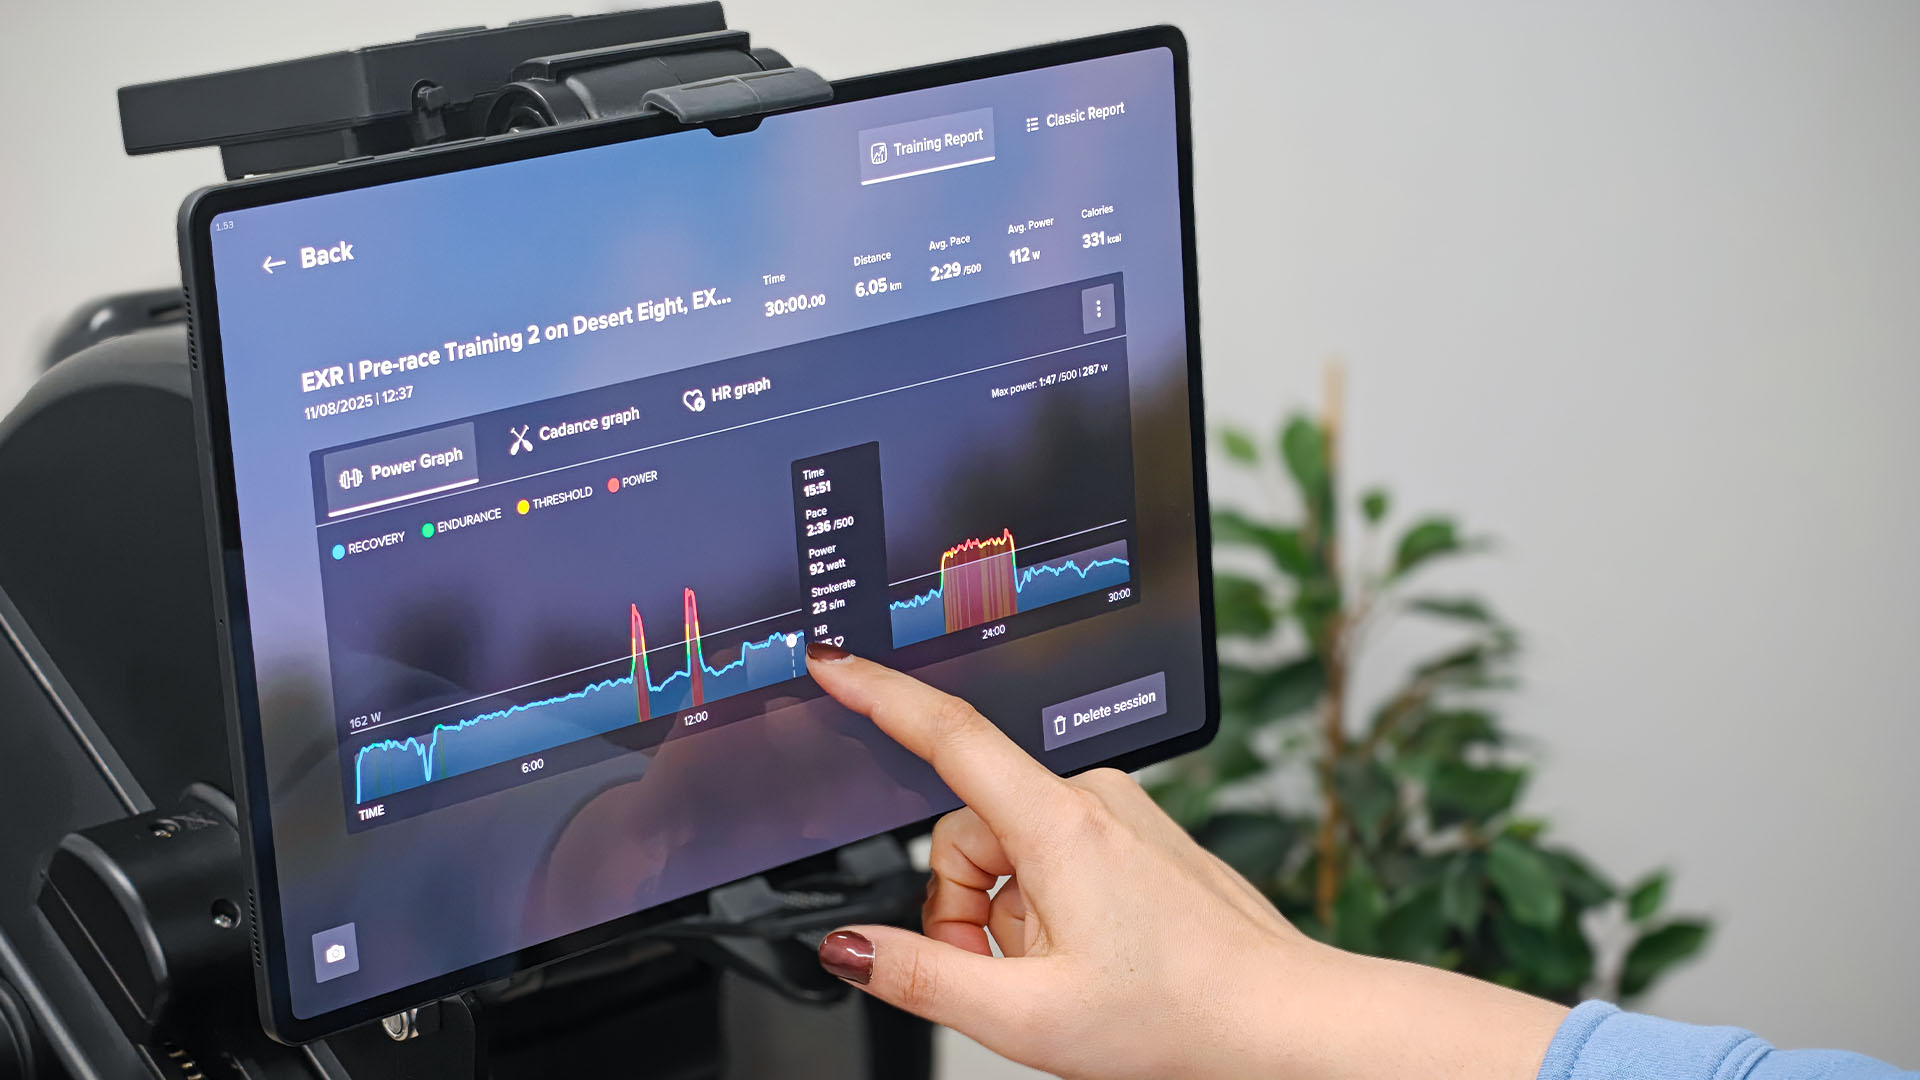
- The Training Report visualizes your data as a Power Graph, Cadence Graph and HR Graph with extra options for more information.
- The Classic Report presents your performance divided into intervals or 500 m distances. It lists the time, distance, pace, power, stroke rate, calories burned and your heart rate.
How to read the reports
The Power Graph is based on your FTP-score. By updating your FTP-score, the visualization of your performance changes accordingly.
The Training Report features the following indicators:
- The white horizontal line indicates your FTP.
- Blue lines indicate a power output being lower than your FTP (ideal for a recovery focus).
- Green lines indicate a power output similar to your FTP (ideal for an endurance focus).
- Yellow lines indicate a power output slightly above your FTP (ideal for a threshold focus).
- Red lines indicate a power output higher than your FTP (ideal for a power focus).
- The maximum value shown in the top-right corner shows your maximum output.
The HR zones in the report are based on your maximum heart rate which you can update in your settings.